scioPhospho combines the advantages of a robust and cost-efficient protein expression profiling using scioDiscover with information on phosphorylation status. This combination provides a comprehensive overview on signalling events and pathway activity regulation.
Features
1,300 highly relevant proteins are profiled in a single assay
Phosphorylation status combined with protein expression levels
Tyrosine, serine and threonine phosphorylation
Analysis of individual phosphorylation types available
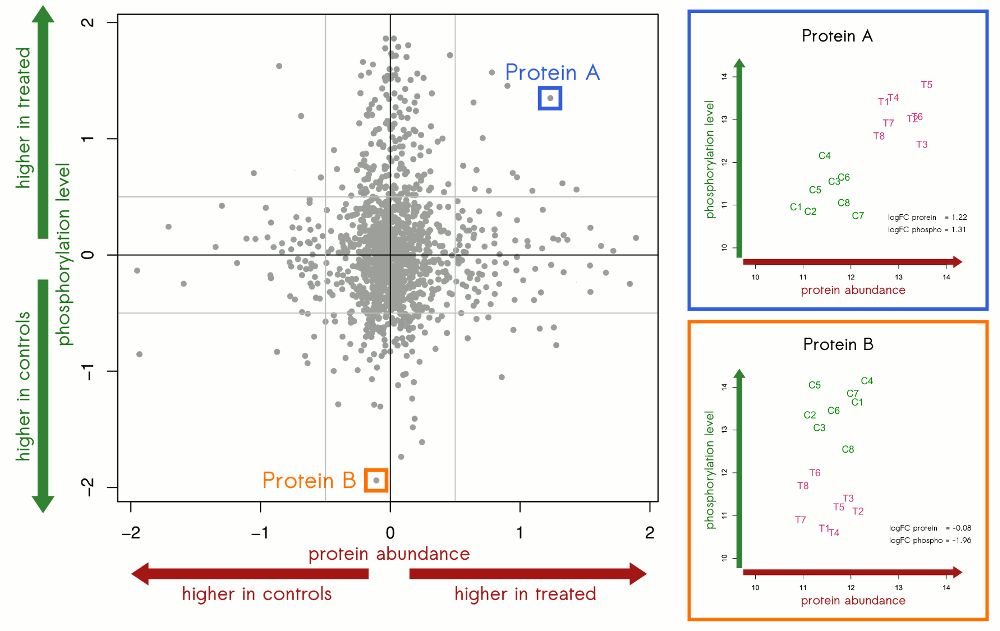
Eight treated cell line samples were compared with 8 control samples. Several proteins were identified as differentially expressed (x-axis) and/or phosphorylated (y-axis). While the left plot provides an overview on expression / phosphorylation differences for all tested proteins in the two sample groups, individual levels are depicted in the plots on the right. The sample status is indicated as C = control or T = treated.
Reference customers
Prof. Dr. Mathias Heikenwälder, German Cancer Research Center, Heidelberg, Germany
Dr. Caroline Pabst. University Hospital Halle, Germany
With the scioPhospho service a variety of samples can be analysed:
fresh frozen tissue samples
cellular content
cerebrospinal fluid
plasma / serum
additional sample types on request
Sample-to-result service
Within our analysis service, we will not only carry out the microarray experiments but also support you with a suggestion for an appropriate microarray study design as well as with the sample selection process in order to address your scientific question in the optimal way. Within 3-4 weeks after receipt of your samples you will receive a customised study report including a statistical analysis.
Our analysis service includes:
definition of an appropriate study design
sample preparation
protein extraction
protein concentration measurements
protein quality control
sample labelling
sample purification
incubation of the samples on antibody microarrays
microarray scanning
raw data acquisition
data normalisation
data analysis including cluster analysis
statistical testing for differentially abundant proteins
statistical testing for differentially phosphorylated proteins
comprehensive study report
scioPhospho combines the advantages of a robust and cost-efficient protein expression profiling using scioDiscover with information on phosphorylation status. This combination provides a comprehensive overview on signalling events and pathway activity regulation.
Features
1,300 highly relevant proteins are profiled in a single assay
Phosphorylation status combined with protein expression levels
Tyrosine, serine and threonine phosphorylation
Analysis of individual phosphorylation types available
Eight treated cell line samples were compared with 8 control samples. Several proteins were identified as differentially expressed (x-axis) and/or phosphorylated (y-axis). While the left plot provides an overview on expression / phosphorylation differences for all tested proteins in the two sample groups, individual levels are depicted in the plots on the right. The sample status is indicated as C = control or T = treated.
Reference customers
Prof. Dr. Mathias Heikenwälder, German Cancer Research Center, Heidelberg, Germany
Dr. Caroline Pabst. University Hospital Halle, Germany
With the scioPhospho service a variety of samples can be analysed:
fresh frozen tissue samples
cellular content
cerebrospinal fluid
plasma / serum
additional sample types on request
Sample-to-result service
Within our analysis service, we will not only carry out the microarray experiments but also support you with a suggestion for an appropriate microarray study design as well as with the sample selection process in order to address your scientific question in the optimal way. Within 3-4 weeks after receipt of your samples you will receive a customised study report including a statistical analysis.
Our analysis service includes:
definition of an appropriate study design
sample preparation
protein extraction
protein concentration measurements
protein quality control
sample labelling
sample purification
incubation of the samples on antibody microarrays
microarray scanning
raw data acquisition
data normalisation
data analysis including cluster analysis
statistical testing for differentially abundant proteins
statistical testing for differentially phosphorylated proteins